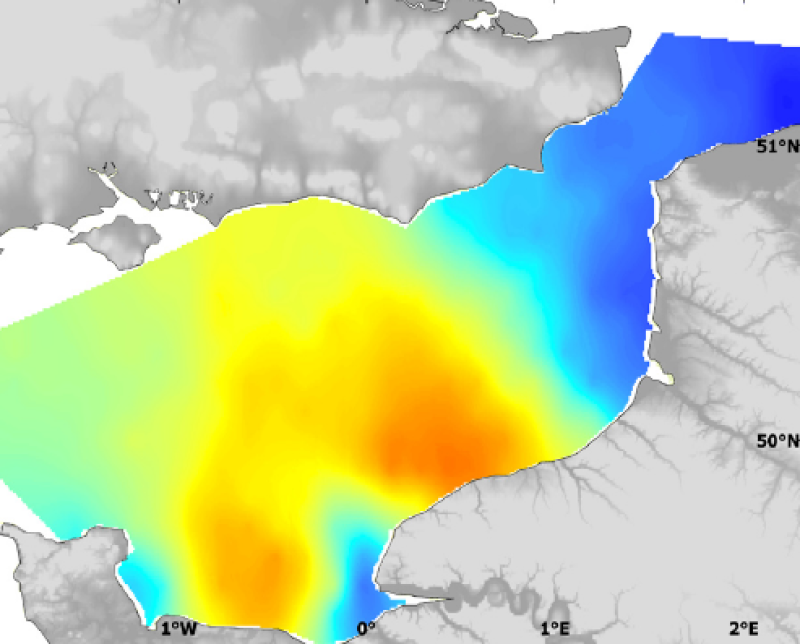
Species and habitats - Spondyliosoma cantharus - Mature - Mean abundance in October, standard deviation and summed kriging error maps during CGFS (1988-2006)
Biologic data have been expressed in abundance (numbers or density values (nbr/km²)) and always required to be log-transformed using a log10(x+1) transformation. Abundance mean (mean) and standard deviation (st) have been calculated. The sum of the kriging error for each yearly kriged abundance fits to the kriging error (v).
)))