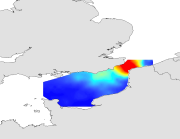
Species and habitats - Microstomus kitt - All ages - Mean abundance in October, standard deviation maps during CGFS (1988-2009)
Biologic data have been expressed in abundance (numbers or density values (nbr/km²)) and always required to be log-transformed using a log10(x+1) transformation. Abundance mean (mean) and standard deviation (st) have been calculated.
)))