The Southen Adriatic Observatory - E2M3A
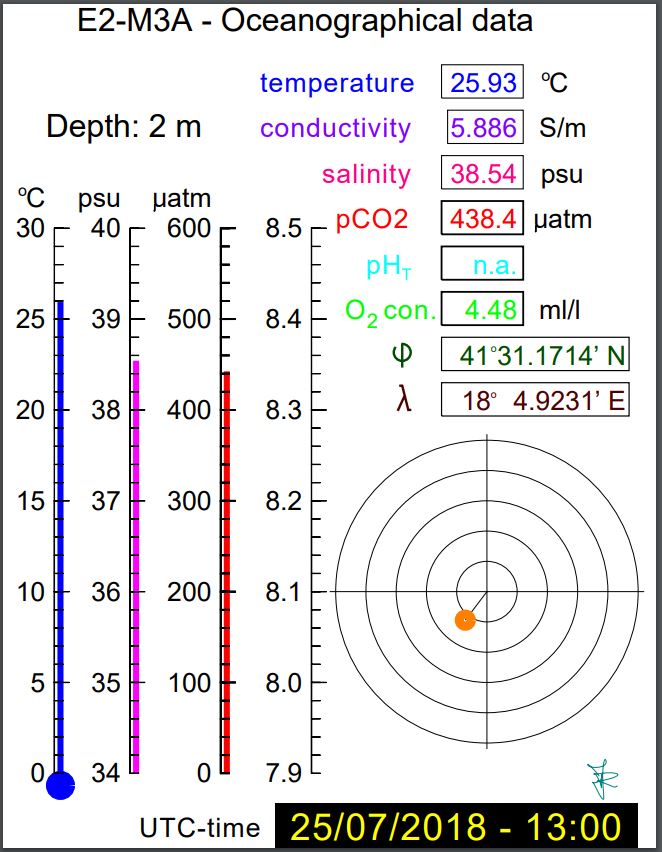
"The E2M3A observatory, located in the Southern Adriatic Pit, works almost continuously since 2006 hosting the longest open-sea time series in the Adriatic (Eastern Mediterranean Sea). The recorded time-series at the E2-M3A station can be used for studies of long-term changes of Adriatic response to local climatic forcing.
E2M3A Observatory has open access to data, mostly provided in real-time on the variation of surface temperature, salinity, oxygen, as well as meteorological data and surface water carbonate system (pH, pCO2) to assess ocean acidification. These data contribute to regional models. Atmospheric-sea interaction is obtained by means of total heat fluxes calculated at the site. Derived products as water column heat content change and water column Hoffmöller diagrams are obtained from temperature and salinity data at different levels of the ocean interior down to the seafloor facilitating the understanding of the deep water formation process taking place in the area. Plus, 10 days plots from RT data are available in graphical format. Time series are available for visualization through web graphic tool and graphic output
"
Simple
- Title
-
The Southen Adriatic Observatory - E2M3A
- Date (Publication)
- Abstract
-
"The E2M3A observatory, located in the Southern Adriatic Pit, works almost continuously since 2006 hosting the longest open-sea time series in the Adriatic (Eastern Mediterranean Sea). The recorded time-series at the E2-M3A station can be used for studies of long-term changes of Adriatic response to local climatic forcing.
E2M3A Observatory has open access to data, mostly provided in real-time on the variation of surface temperature, salinity, oxygen, as well as meteorological data and surface water carbonate system (pH, pCO2) to assess ocean acidification. These data contribute to regional models. Atmospheric-sea interaction is obtained by means of total heat fluxes calculated at the site. Derived products as water column heat content change and water column Hoffmöller diagrams are obtained from temperature and salinity data at different levels of the ocean interior down to the seafloor facilitating the understanding of the deep water formation process taking place in the area. Plus, 10 days plots from RT data are available in graphical format. Time series are available for visualization through web graphic tool and graphic output
"
- Point of contact
-
Organisation name Individual name Electronic mail address Role OGS (Istituto Nazionale di Oceanografia e di Geofisica Sperimentale
Vanessa Cardin
Local service desk
-
Agreed Parameter Groups (P03)
-
-
Currents
-
Currents, sea level and waves
-
Water column temperature and salinity
-
Meteorology
-
-
AtlantOS Essential Variables
-
-
Carbonate system
-
Oxygen
-
- Keywords
-
-
Observations
-
- Use limitation
-
No condition applies
- Access constraints
- Other restrictions
- Use constraints
- Other restrictions
- Spatial representation type
- Vector
- Language
- English
- Character set
- UTF8
- Topic category
-
- Oceans
))
- Distribution format
-
Name Version
- OnLine resource
-
Protocol Linkage Name WWW:LINK-1.0-http--link
http://nettuno.ogs.trieste.it/e2-m3a/
- Hierarchy level
- Dataset
Conformance result
- Title
-
Inspire specifications
- Date (Creation)
- 2012-01-16
- Explanation
-
Non évalué
Metadata
- File identifier
- 1e71aaa9-e6d6-4a51-8990-bb4b5c52eedd
- Metadata language
- English
- Character set
- UTF8
- Hierarchy level
- Dataset
- Date stamp
- 2018-07-25T16:48:29
- Metadata standard name
-
ISO 19115:2003/19139 - SEXTANT
- Metadata standard version
-
1.0
accessData
Overviews
)))