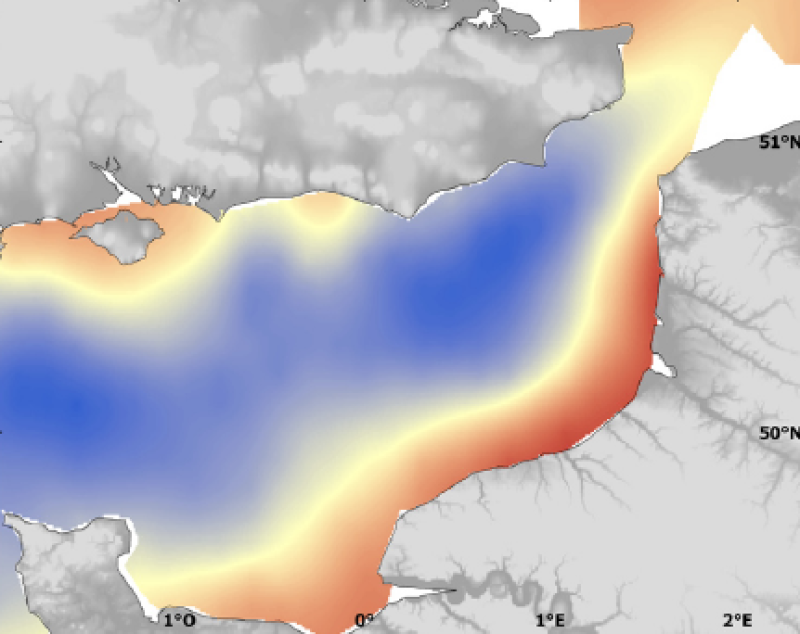
Physical environment - In situ data - Mean bottom temperature, standard deviation, kriging error during Beam Trawl Surveys (BTS) from 1989 to 2006
Temperature and salinity were measured in situ at sea surface and at bottom during the BTS surveys from 1989 to 2006 (nevertheless, it should be noted that some of these data were not available for all years). Temperature and salinity were measured using a probe. These surveys give illustration of summer conditions.
Simple
- Title
-
Physical environment - In situ data - Mean bottom temperature, standard deviation, kriging error during Beam Trawl Surveys (BTS) from 1989 to 2006
- Alternate title
-
BTS_environment_geostatS
- Date (Publication)
- 2009-12-31T00:00:00
- Citation identifier
- CHARM_BTS_BTEMP_KRIG_R
- Presentation form
- Digital map
- Other citation details
-
Source CHARM Consortium
- Abstract
-
Temperature and salinity were measured in situ at sea surface and at bottom during the BTS surveys from 1989 to 2006 (nevertheless, it should be noted that some of these data were not available for all years). Temperature and salinity were measured using a probe. These surveys give illustration of summer conditions.
- Credit
-
CEFAS
- Credit
-
CHARM consortium
- Status
- Completed
- Point of contact
-
Organisation name Individual name Electronic mail address Role Center for Environment, Fisheries & Aquaculture Science
Steve Mackinson
Local service desk CHARM Consortium
CHARM Consortium
Production center
- Maintenance and update frequency
- As needed
-
Thèmes Sextant
-
-
/Physical Environment/Physical Habitats
-
- Discipline
-
-
Species data set
-
CHARM
-
-
GEMET - INSPIRE themes, version 1.0
-
-
Habitats et biotopes
-
-
external.theme.gemet
-
-
ressource halieutique
-
- Use limitation
-
research-only
- Access constraints
- License
- Other legal constraints
-
Has to be cited this way in maps : "Source CHARM Consortium"
- Other legal constraints
-
Has to be cited this way in bibliography : "Carpentier A, Martin CS, Vaz S (Eds.), 2009. Channel Habitat Atlas for marine Resource Management, final report / Atlas des habitats des ressources marines de la Manche orientale, rapport final (CHARM phase II). INTERREG 3a Programme, IFREMER, Boulogne-sur-mer, France. 626 pp. & CD-rom"
- Spatial representation type
- Grid
- Denominator
- 25000
- Language
- Français
- Language
- English
- Character set
- UTF8
- Topic category
-
- Oceans
- Environment description
-
Microsoft Windows XP ; ESRI ArcGIS 9.x
- Geographic identifier
- Eastern English Channel
))
- Begin date
- 1989-01-01
- End date
- 2006-12-31
- Reference system identifier
- WGS 84 (EPSG:4326)
- Number of dimensions
- 2
- Dimension name
- Column
- Dimension size
- 627
- Resolution
- 0.009 degree
- Dimension name
- Row
- Dimension size
- 545
- Resolution
- 0.009 degree
- Cell geometry
- Area
- Transformation parameter availability
Distributor
- Distributor contact
-
Organisation name Individual name Electronic mail address Role Ifremer - Centre de Brest
Dissemination Unit
- Distributor format
-
Name Version
- OnLine resource
-
Protocol Linkage Name WWW:LINK
http://www.ifremer.fr/charm/ COPYFILE
Mean bottom temperature
COPYFILE
Standard deviation
COPYFILE
Kriging error
OGC:WMS
https://sextant.ifremer.fr/services/wms/wms_charm CHARM_BTS_BTEMP_R
OGC:WMS
https://sextant.ifremer.fr/services/wms/wms_charm CHARM_BTS_BTEMP_SD_R
OGC:WMS
https://sextant.ifremer.fr/services/wms/wms_charm CHARM_BTS_BTEMP_KRIG_R
- Hierarchy level
- Dataset
- Statement
-
The standard survey has a total of approximately 100 tows or stations (75 are in ICES division VIId,25 are in ICES division Ivc). Salinity and temperature were measured from surface to seabed using a probe attached on the headrope of the trawl. There is a lack of measuring in 1991, 1992, 1995, 1996, 1997 for surface temperature and surface salinity, and in 1991, 1992, 1993, 1994, 1995, 1996, 1997, 1998, 1999 and 2000 for bottom temperature and bottom salinity.
- Description
-
For each parameter (surface and bottom temperature, surface and bottom salinity), the average (mean) and the standard deviation (sd) are computed from kriged annual maps over all the available period. The sum of all annual kriging error over the same period (v) is also computed. The resulting grids of points were imported into ArcMap and interpolated with the Spatial Analyst extension in order to create a continuous raster of 1 km² resolution. The resulting maps illustrate the average pattern (mean), its interannual variability (sd) and its overall interpolation error (summed kriging error) of each parameter.
- Description
-
BTS surveys, annual scientific surveys of CEFAS
Metadata
- File identifier
- 8c9a485c-d6de-4f23-b0b1-c55e5ad9fdec
- Metadata language
- English
- Character set
- UTF8
- Hierarchy level
- Dataset
- Date stamp
- 2020-06-04T00:27:51
- Metadata standard name
-
ISO 19115:2003/19139 - SEXTANT
- Metadata standard version
-
1.0
- Metadata author
-
Organisation name Individual name Electronic mail address Role Ifremer
Fanny Lecuy
Local service desk
accessData
Overviews
)))