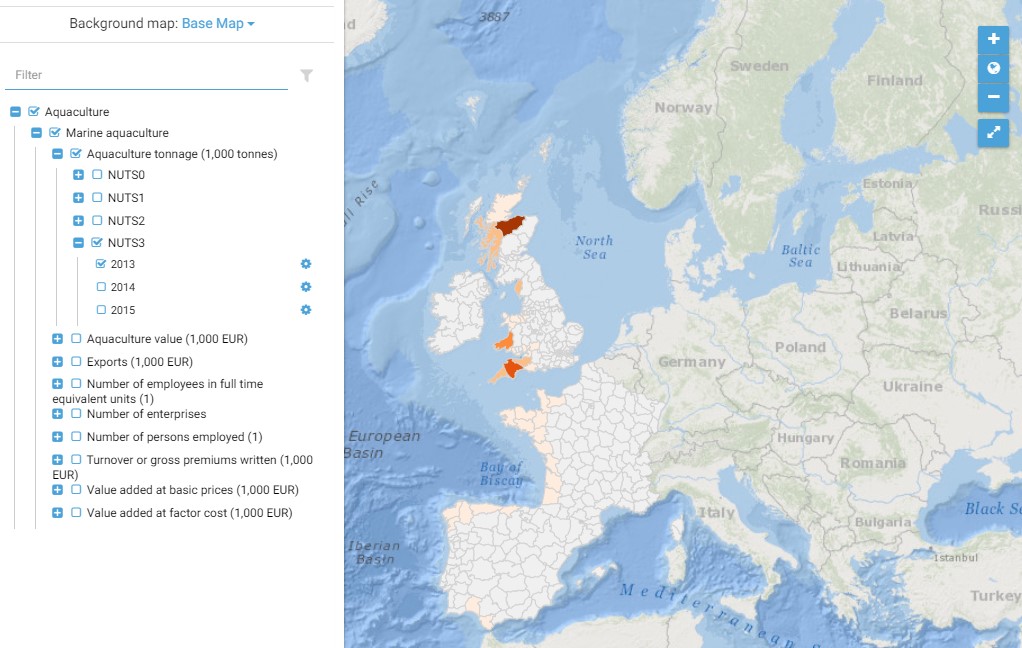
Marine aquaculture (NACE : A.03.21)
This map presents all layers corresponding to "Marine aquculture" activities in the Atlantic area. For more information about this NACE code : https://ec.europa.eu/eurostat/ramon/nomenclatures/index.cfm?TargetUrl=DSP_NOM_DTL_VIEW&StrNom=NACE_REV2&StrLanguageCode=FR&IntPcKey=18495314&IntKey=18495344&StrLayoutCode=HIERARCHIC&IntCurrentPage=1
Indicators collected are :
- Business indicators per country
- Number of persons employed and number of employees in full time equivalent units per NUTS 3 unit of the Atlantic Area
- Tonnage produced per Atlantic NUTS3 unit
- Value produced per Atlantic NUTS 3 unit
| Date(s)Date(s) |
|
| Author(s)Auteur(s) | Kalaydjian Regis
(IFREMER)
|
| SourceSource |
MOSES project |
| LineageGénéalogie |
The methodology and framework used for developing the MOSES economic database are based on the work performed for MARNET – an Atlantic Area IV Interreg project (2009-2012) to analyse marine activities in the Atlantic Area. The three dimensions of the MOSES database are similar to that of MARNET: a set of selected marine activities, a set of yearly indicators characterizing each activity, and a common time frame for the indicators, 2013- 2015. - Marine economic activities are identified based on the NACE. The NACE hierarchical classification of economic activities, used by Eurostat, is exhaustive; all activities are classified by NACE class, with one code per class. It avoids double counting. Each activity has one code. It readily allows access to economic documentation by activity (see Annex 1 below). - The spatial boundaries for measurement of marine economic activities are based on the European territorial units referred to as the Nomenclature of territorial units for statistics (NUTS). The NUTS includes countries (level 0 of the NUTS) and regions (levels 2 and 3 of the NUTS). The coverage of the database is limited to Atlantic regions, i.e. units with an Atlantic shoreline - Economic indicators are selected among those currently used by these sources for developing the Structural Business Statistics and National Accounts. Such indicators are available at NUTS0 only. At NUTS2 and NUTS3 (regions and sub-regions), only the number of establishments and employment data can be documented. - Specific "proxies" are collected to supplement economic indicators, and are mostly available at a national or local (NUTS2 and 3) level. Proxies are non-monetary indicators characterizing important features of certain marine activities (see Annex 2). - The time frame of the MOSES database (2013-2015) follows that of MARNET (2005-2012). |
| ConstraintsContraintes |
|
| Spatial informationsInformations géographiques |
|


)))