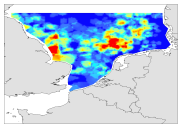
Species and habitats - Callionymidae - All ages - IBTS Multi-annual abundance in January (1980-1990, 1991-2000, 2001-2010))
Average maps were computed based on the interpolated maps of the two periods only. Biologic data have been expressed in abundance (numbers or density values (nbr/km²)) and always required to be log-transformed using a log10(x+1) transformation.
)))